Feature Request / Feedback

Indiana football · 2026–27 & 2027–28

What if Indiana used
Iowa’s classification method?

An enrollment-based look at competitive equity: account for free and reduced-price lunch eligibility, then compare two ways to place schools into six classes.

Iowa method · Smaller 6A and 1A · The class sizes, movement lists and school alignment below reflect the selected projection.

Independent scenario · Prepared October 12, 2026 · Not an official IHSAA proposal

316schools classified
30 / 64 / 64 / 64 / 64 / 30schools in 6A through 1A
129schools change class

01 / The method

Enrollment, adjusted for FRL eligibility

Adjusted enrollment =
Grades 9–11 enrollment × (1 − 0.40 × FRL rate)

For a school with 1,000 students in grades 9–11 and a 37% FRL rate, the adjusted enrollment is 852. Schools are ranked by this number from largest to smallest, without a success-factor adjustment.

Two choices for class balance

The Iowa formula supplies the adjustment. Class sizes are a separate choice. This projection places 30 schools each in 6A and 1A, and 64 each in 2A–5A. Changes reflect both adjusted enrollment and class sizes.

“Current class” means the official class in the supplied Indiana classification document, including success factor. This analysis uses its full 316-school field, not just the tournament draw. Actual official class counts can differ from the projection’s target sizes.

Data assumptions and missing FRL information

Public and charter schools use their corporation’s 2025–26 FRL rate as a proxy. Matched private schools use the IDOE FY2026 school nutrition report. Corporation-wide rates and NSLP/CEP eligibility are imperfect substitutes for school-specific income-based FRL data.

Culver Academies, Park Tudor and Evansville Reitz Memorial have no matched FRL entry. Their grades 9–11 enrollments are left unadjusted. This is a missing-data assumption, not a finding that their FRL rate is zero; different rates could change their placement and the cutoffs for other schools.

Assignments use unrounded adjusted enrollment; ties are ordered alphabetically. Displayed values are rounded to two decimals.

02 / Enrollment distribution

Most schools sit toward the smaller end

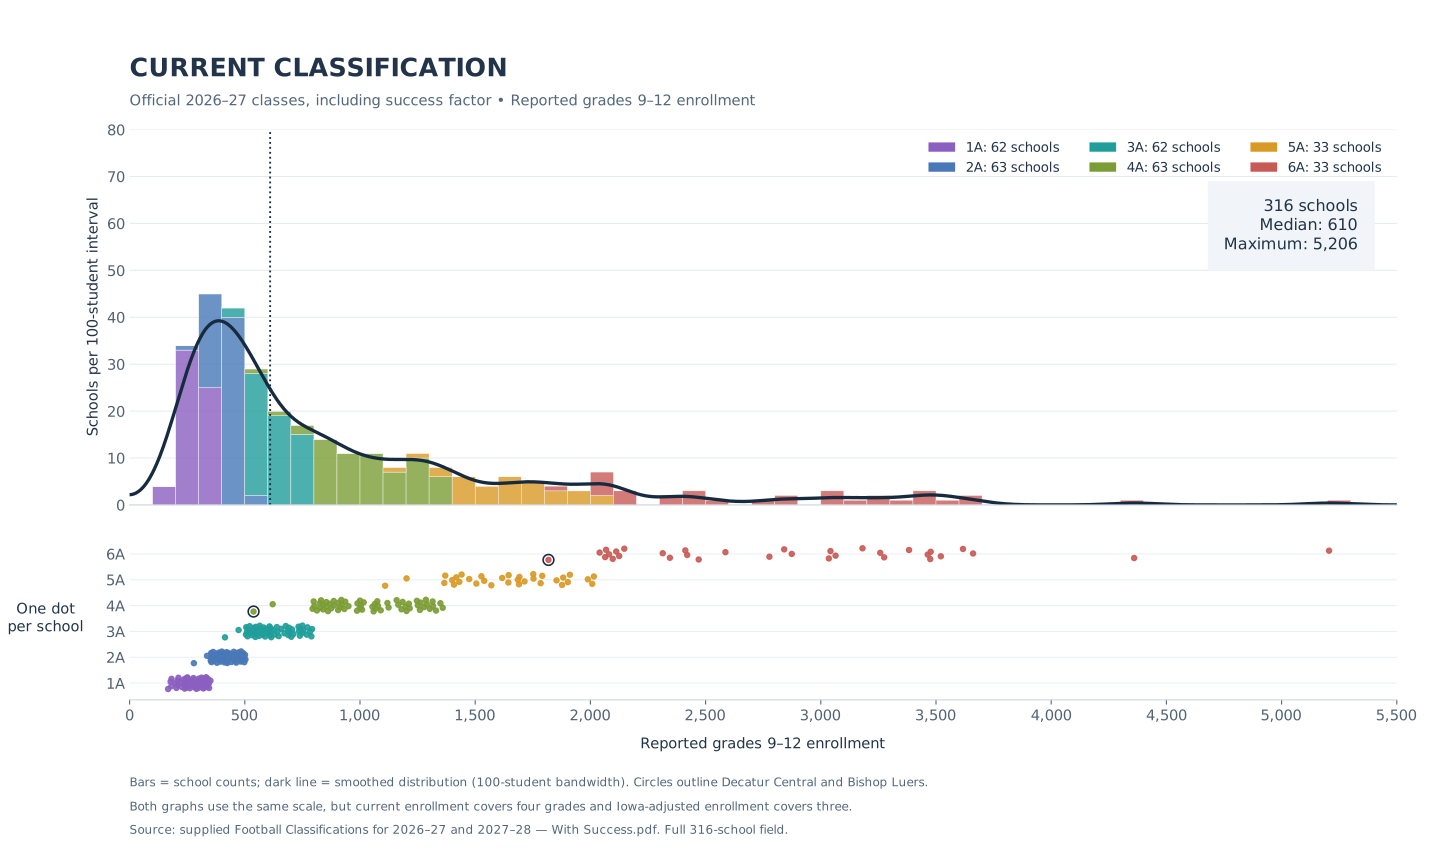
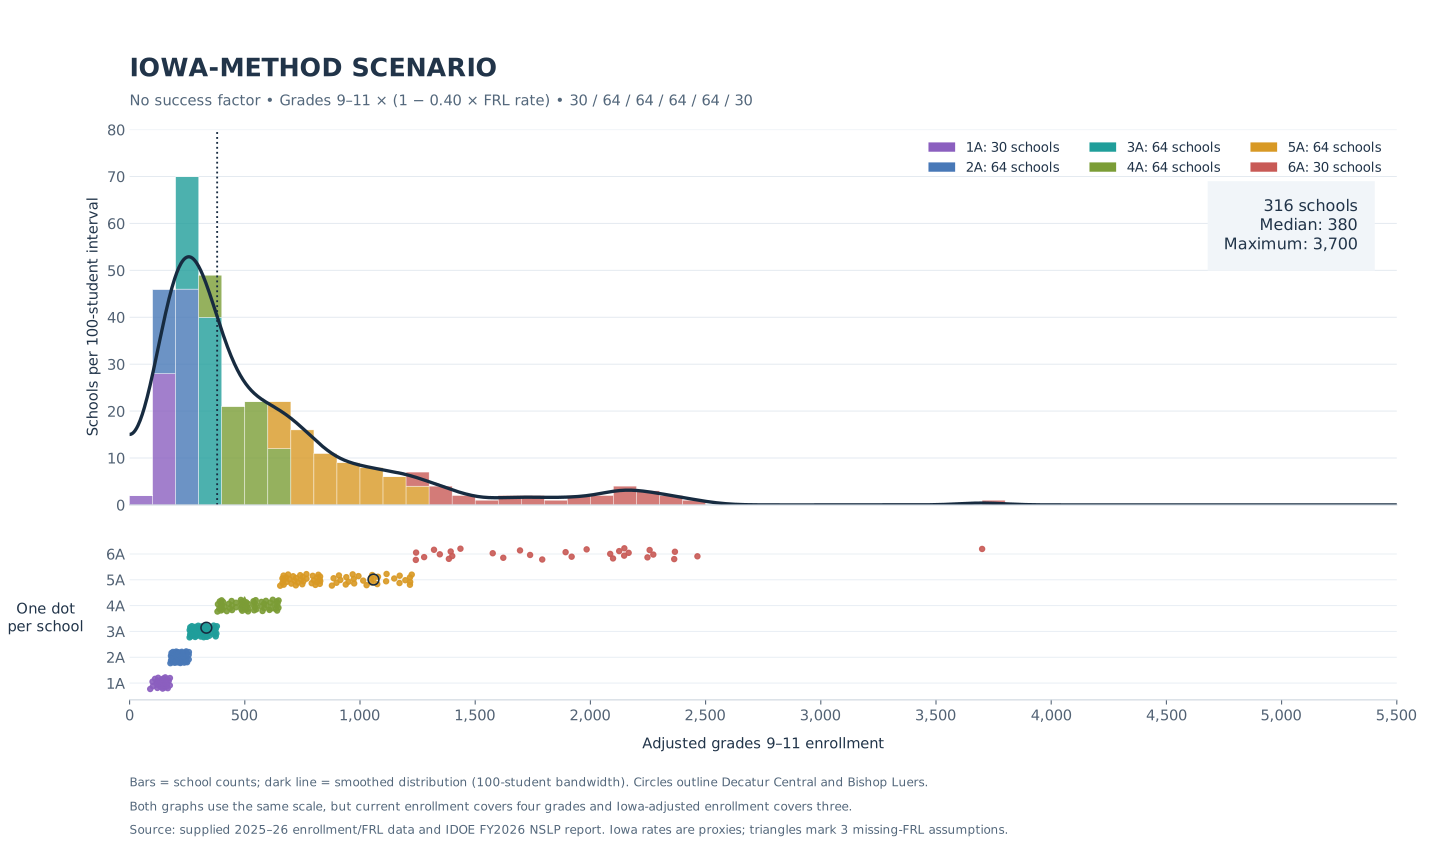
The curves trace the actual, skewed distribution rather than a symmetrical bell curve. Each dot represents one school. Both graphs use the same scale, but the current graph counts grades 9–12 while the Iowa graph adjusts grades 9–11. The Iowa graph depicts the original smaller-6A-and-1A projection; the school tables and movement lists reflect your selected projection.

Current classification: enrollment histogram and individual schools plotted by class. Median 610; maximum 5,206.
Current classification · Select the graph to view full size.
Iowa-method scenario: enrollment histogram and individual schools plotted by class. Median 380; maximum 3,700; 30 schools in 6A and 1A.
Iowa-method scenario · Select the graph to view full size.

03 / Who moves?

A new balance across the classes

Grouped by each school’s new Iowa-method class. Parentheses show its current official class.

Schools in Higher Class 123

Class 6A

  • Chesterton (5A)
  • McCutcheon (5A)

Class 5A

  • Bedford North Lawrence (4A)
  • Columbia City (4A)
  • Columbus East (4A)
  • East Central (4A)
  • Evansville F.J. Reitz (4A)
  • Evansville Harrison (4A)
  • Fort Wayne Bishop Dwenger (4A)
  • Fort Wayne North Side (4A)
  • Greenwood Community (4A)
  • Hammond Morton (4A)
  • Hobart (4A)
  • Indianapolis Shortridge (4A)
  • Jasper (4A)
  • Jennings County (4A)
  • Kokomo (4A)
  • Lebanon (4A)
  • Lowell (4A)
  • Martinsville (4A)
  • Mishawaka (4A)
  • Mooresville (4A)
  • Muncie Central (4A)
  • New Haven (4A)
  • Northridge (4A)
  • Richmond (4A)
  • Roncalli (4A)
  • Shelbyville (4A)
  • Silver Creek (4A)
  • South Bend Riley (4A)

Class 4A

  • Angola (3A)
  • Batesville (3A)
  • Corydon Central (3A)
  • Crawfordsville (3A)
  • Edgewood (3A)
  • Evansville Mater Dei (3A)
  • Evansville Reitz Memorial (3A)
  • Fairfield (3A)
  • Fort Wayne Concordia Lutheran (3A)
  • Gibson Southern (3A)
  • Greensburg (3A)
  • Hamilton Heights (3A)
  • Hammond Bishop Noll (3A)
  • Heritage Christian (3A)
  • Illiana Christian (3A)
  • Indian Creek (3A)
  • Lawrenceburg (3A)
  • Mishawaka Marian (3A)
  • Mississinewa (3A)
  • Mt. Vernon (3A)
  • New Castle (3A)
  • Norwell (3A)
  • Scottsburg (3A)
  • South Bend Washington (3A)
  • Tri-West Hendricks (3A)
  • Vincennes Lincoln (3A)
  • Washington (3A)
  • West Lafayette (3A)
  • West Noble (3A)
  • Western (3A)

Class 3A

  • Alexandria Monroe (2A)
  • Boone Grove (2A)
  • Bremen (2A)
  • Brown County (2A)
  • Brownstown Central (2A)
  • Cascade (2A)
  • Christel House (2A)
  • Covenant Christian (2A)
  • Eastern (Greentown) (2A)
  • Frankton (2A)
  • Greencastle (2A)
  • Indianapolis Cardinal Ritter (2A)
  • Knox (2A)
  • Lakeland (2A)
  • Lapel (2A)
  • Monrovia (2A)
  • North Posey (2A)
  • Northeastern (2A)
  • Oak Hill (2A)
  • Park Tudor (2A)
  • Peru (2A)
  • Pike Central (2A)
  • Providence (2A)
  • Rensselaer Central (2A)
  • Rochester Community (2A)
  • Salem (2A)
  • Seeger (2A)
  • Southmont (2A)
  • Tipton (2A)
  • Triton Central (2A)
  • West Vigo (2A)

Class 2A

  • Carroll (Flora) (1A)
  • Churubusco (1A)
  • Clinton Prairie (1A)
  • Cloverdale (1A)
  • Crawford County (1A)
  • Faith Christian (1A)
  • Forest Park (1A)
  • Fort Wayne Blackhawk Christian (1A)
  • Fountain Central (1A)
  • Fremont (1A)
  • Henryville (1A)
  • Knightstown (1A)
  • Lafayette Central Catholic (1A)
  • Madison-Grant (1A)
  • Milan (1A)
  • Monroe Central (1A)
  • North Decatur (1A)
  • North Judson-San Pierre (1A)
  • North Knox (1A)
  • North Newton (1A)
  • Parke Heritage (1A)
  • Riverton Parke (1A)
  • Sheridan (1A)
  • South Adams (1A)
  • South Central (Union Mills) (1A)
  • Taylor (1A)
  • Tecumseh (1A)
  • Trinity Lutheran (1A)
  • Union County (1A)
  • West Washington (1A)
  • Whitko (1A)
  • Winamac Community (1A)

Schools in Lower Class 6

Class 5A

  • Decatur Central (6A)
  • Fort Wayne Northrop (6A)
  • Merrillville (6A)
  • Portage (6A)
  • Whiteland Community (6A)

Class 3A

  • Fort Wayne Bishop Luers (4A)

04 / The full classification

Find your school’s new class

Listed by adjusted enrollment, largest first within each class. Gold highlights identify the success-factor comparisons above.
316 schools shown

CLASS 6A

30 schools · 1,242.33–3,700.14 adjusted enrollment
Class 6A schools ranked by adjusted enrollment
SchoolCurrent classGrades 9–11FRL rateAdjusted enrollment
Carmel6A3,89912.8%3,700.14
Fishers6A2,69021.0%2,464.51
Ben Davis6A3,32772.1%2,366.83
Hamilton Southeastern6A2,58021.0%2,363.73
Brownsburg6A2,63334.2%2,272.95
North Central (Indianapolis)6A2,76045.6%2,257.08
Penn6A2,60834.5%2,247.71
Noblesville6A2,41625.9%2,165.99
Avon6A2,67249.1%2,147.31
Westfield6A2,34821.5%2,146.54
Franklin Central6A2,64148.9%2,124.94
Crown Point6A2,31623.5%2,098.19
Center Grove6A2,32325.5%2,085.94
Pike6A2,43746.5%1,983.68
Lake Central6A2,13725.5%1,918.61
Warren Central6A2,49160.1%1,892.40
Carroll (Fort Wayne)6A1,96822.5%1,790.90
Elkhart6A2,20152.6%1,738.22
Zionsville6A1,7457.2%1,694.50
Homestead6A1,78222.5%1,621.86
Lawrence North6A2,05958.6%1,576.05
Lawrence Central6A1,87658.6%1,435.97
Valparaiso6A1,58429.0%1,400.31
Southport6A1,92068.5%1,393.64
Harrison (West Lafayette)6A1,62336.5%1,385.77
Perry Meridian6A1,85568.5%1,346.46
Columbus North6A1,56839.3%1,321.20
Chesterton5A1,44328.5%1,278.37
Jeffersonville6A1,61757.7%1,243.48
McCutcheon5A1,45536.5%1,242.33

CLASS 5A

64 schools · 653.58–1,224.57 adjusted enrollment
Class 5A schools ranked by adjusted enrollment
SchoolCurrent classGrades 9–11FRL rateAdjusted enrollment
Whiteland Community6A1,60058.7%1,224.57
Castle5A1,41635.0%1,217.76
Portage6A1,52650.7%1,216.76
Warsaw Community5A1,50748.2%1,216.71
Merrillville6A1,53154.6%1,196.71
Plainfield5A1,37937.5%1,172.22
Bloomington South5A1,38037.8%1,171.48
Fort Wayne Northrop6A1,52561.7%1,148.60
New Albany5A1,34642.9%1,115.29
Lafayette Jefferson5A1,51866.6%1,113.34
Floyd Central5A1,30142.9%1,078.00
Indianapolis Arsenal Technical5A1,47467.7%1,074.90
Decatur CentralSuccess-factor comparison6A1,42964.8%1,058.51
Fort Wayne Snider5A1,39861.7%1,052.94
South Bend Adams5A1,39662.0%1,049.56
Mt. Vernon (Fortville)5A1,18829.6%1,047.46
LaPorte5A1,26346.4%1,028.56
Evansville North5A1,29654.4%1,013.92
Munster5A1,09022.2%993.42
Goshen5A1,31664.8%974.73
Bloomington North5A1,14637.8%972.83
Anderson5A1,27359.8%968.26
Concord5A1,25260.2%950.29
Franklin Community5A1,15346.1%940.61
Hammond Central5A1,21857.4%938.18
Seymour5A1,20359.9%914.74
Pendleton Heights5A1,05234.1%908.60
Greenfield-Central5A1,06138.4%897.99
Terre Haute South Vigo5A1,16459.8%885.41
Huntington North5A1,11352.8%878.04
Columbus East4A98239.3%827.44
New Palestine5A92225.8%826.76
Fort Wayne South Side5A1,09661.7%825.48
Terre Haute North Vigo5A1,08459.8%824.56
East Central4A90122.7%819.35
Evansville Harrison4A1,04054.4%813.64
Indianapolis Cathedral5A85010.9%812.90
Mooresville4A99447.2%806.49
Fort Wayne Wayne5A1,06261.7%799.87
Northridge4A92435.0%794.71
Kokomo4A1,03959.8%790.37
Columbia City4A88332.7%767.67
Evansville F.J. Reitz4A98154.4%767.48
Fort Wayne North Side4A1,00161.7%753.93
South Bend Riley4A1,00062.0%751.83
Michigan City5A1,05372.1%749.33
Hammond Morton4A96657.4%744.07
Greenwood Community4A92449.6%740.54
Martinsville4A91851.2%730.01
Hobart4A93256.3%722.16
Richmond4A96863.7%721.38
Roncalli4A81129.3%715.94
Muncie Central4A1,02476.7%709.70
Mishawaka4A96968.9%702.08
Jasper4A81136.5%692.56
Silver Creek4A78430.6%687.92
Lowell4A77028.6%681.88
Indianapolis Shortridge4A93167.7%678.92
Bedford North Lawrence4A89362.7%669.06
New Haven4A84151.3%668.44
Jennings County4A88861.9%668.28
Shelbyville4A81546.5%663.49
Lebanon4A81747.0%663.35
Fort Wayne Bishop Dwenger4A71320.8%653.58

CLASS 4A

64 schools · 381.30–646.63 adjusted enrollment
Class 4A schools ranked by adjusted enrollment
SchoolCurrent classGrades 9–11FRL rateAdjusted enrollment
Highland4A79045.4%646.63
Indianapolis Crispus Attucks4A88667.7%646.11
Beech Grove4A72628.8%642.39
Logansport4A83959.2%640.28
New Prairie4A74736.0%639.31
Evansville Central4A81654.4%638.39
East Noble4A74336.7%634.07
Plymouth4A73133.9%631.93
South Bend Saint Joseph4A70028.1%621.34
Culver AcademiesMissing FRL · no reduction assumed4A615Unknown615.00
Hanover Central4A66419.9%611.05
Brebeuf Jesuit Preparatory4A6246.8%607.10
Guerin Catholic4A6002.1%594.89
Danville Community4A69637.5%591.58
Boonville4A68035.0%584.80
DeKalb4A70542.9%584.05
Kankakee Valley4A70645.7%576.87
East Chicago Central4A79269.4%572.29
Indianapolis Bishop Chatard4A60413.2%572.05
Frankfort4A69852.9%550.43
Northview4A66944.9%548.93
NorthWood4A64337.2%547.36
Yorktown4A64940.0%545.14
Leo4A68151.3%541.27
Marion4A76673.5%540.70
Charlestown4A70257.7%539.84
Fort Wayne Concordia Lutheran3A58520.3%537.56
Gary West Side4A77282.9%516.06
West Lafayette3A56722.9%515.03
Gibson Southern3A57727.3%514.04
Jay County4A65154.7%508.66
Delta4A62748.1%506.30
Edgewood3A58333.4%505.13
Norwell3A57632.8%500.37
Evansville Reitz MemorialMissing FRL · no reduction assumed3A499Unknown499.00
New Castle3A60343.6%497.72
Hamilton Heights3A56231.1%492.00
Wawasee4A62554.5%488.86
Evansville Bosse4A62454.4%488.18
Connersville4A63959.2%487.78
Illiana Christian3A5028.6%484.79
Washington3A59646.9%484.10
Western3A56134.7%483.07
Madison Consolidated4A58853.7%461.77
Batesville3A52128.5%461.69
Hammond Bishop Noll3A57958.0%444.67
Indian Creek3A50529.9%444.57
Corydon Central3A55450.2%442.66
Vincennes Lincoln3A54349.5%435.52
Lawrenceburg3A50737.8%430.43
Crawfordsville3A53552.9%421.81
Fairfield3A47030.8%412.03
Scottsburg3A52857.7%406.09
Angola3A50449.9%403.50
Evansville Mater Dei3A4179.5%401.11
Tri-West Hendricks3A44123.6%399.45
West Noble3A51758.0%397.02
South Bend Washington3A52862.0%396.97
Heritage Hills4A46536.7%396.70
Mishawaka Marian3A62190.7%395.73
Mississinewa3A50757.0%391.43
Greensburg3A47746.0%389.24
Heritage Christian3A3957.4%383.34
Mt. Vernon3A45239.1%381.30

CLASS 3A

64 schools · 260.38–378.70 adjusted enrollment
Class 3A schools ranked by adjusted enrollment
SchoolCurrent classGrades 9–11FRL rateAdjusted enrollment
Franklin County3A43632.9%378.70
Northwestern3A42830.0%376.69
Griffith3A48657.7%373.92
South Dearborn3A46448.6%373.75
Bellmont3A45546.3%370.66
North Harrison3A44340.9%370.55
Glenn3A45849.0%368.27
Owen Valley3A46954.0%367.74
Twin Lakes3A47056.0%364.79
Speedway3A44553.3%350.21
Woodlan3A43651.3%346.54
Bluffton3A43350.3%345.93
Purdue Polytechnic - Downtown3A45262.1%339.77
Heritage3A42551.3%337.79
Indianapolis George Washington3A46367.7%337.64
North Montgomery3A39938.5%337.63
Jimtown3A39939.6%335.76
Lakeland2A34911.2%333.32
Fort Wayne Bishop LuersSuccess-factor comparison4A41649.8%333.11
Rushville Consolidated3A43057.0%331.91
Garrett3A40645.9%331.50
River Forest3A44764.9%330.93
Centerville3A39339.8%330.43
Southmont2A39038.6%329.82
Cascade2A37228.5%329.64
Tippecanoe Valley3A41953.5%329.33
Western Boone3A38436.8%327.54
Princeton Community3A41050.8%326.77
Southridge3A41251.9%326.39
Eastbrook3A39345.3%321.84
Providence2A34315.8%321.27
Andrean3A36329.4%320.33
Benton Central3A40050.5%319.13
Park TudorMissing FRL · no reduction assumed2A317Unknown317.00
Lapel2A37038.3%313.29
Frankton2A36838.3%311.60
Eastern (Greentown)2A36939.9%310.10
Oak Hill2A36639.1%308.76
Sullivan3A38350.0%306.36
Covenant Christian2A3118.3%300.71
Triton Central2A35438.5%299.53
Calumet3A48395.2%299.07
Maconaquah3A38958.5%297.92
Boone Grove2A33024.6%297.51
Brown County2A35442.5%293.78
Tipton2A34439.8%289.29
Alexandria Monroe2A34139.3%287.41
Greencastle2A35749.8%285.93
North Posey2A32731.7%285.56
Christel House2A41076.4%284.72
Adams Central3A31725.6%284.50
Salem2A35551.6%281.67
West Vigo2A36759.8%279.16
Bremen2A33945.9%276.76
Pike Central2A33645.2%275.22
Monrovia2A32944.5%270.39
Rensselaer Central2A32040.1%268.63
Knox2A33651.0%267.45
Indianapolis Cardinal Ritter2A36969.5%266.40
Brownstown Central2A32848.1%264.84
Seeger2A31943.6%263.32
Rochester Community2A34358.5%262.72
Peru2A33957.7%260.76
Northeastern2A31845.3%260.38

CLASS 2A

64 schools · 177.06–257.30 adjusted enrollment
Class 2A schools ranked by adjusted enrollment
SchoolCurrent classGrades 9–11FRL rateAdjusted enrollment
Eastern (Pekin)2A31143.2%257.30
Wabash2A34765.1%256.66
Switzerland County2A32049.7%256.41
Wheeler2A28027.1%249.68
Prairie Heights2A30546.8%247.93
Tell City2A30949.8%247.48
South Vermillion2A32459.5%246.84
Eastern Hancock2A28231.9%246.07
Clarksville2A30548.6%245.70
Shenandoah2A29643.1%244.91
Lewis Cass2A30549.6%244.43
Mitchell2A31757.4%244.21
Delphi Community2A29341.9%243.95
Manchester2A30349.9%242.58
Blackford2A31862.0%239.14
Churubusco1A27129.6%238.92
Winchester Community2A28139.1%237.01
Whiting2A32870.7%235.29
Indianapolis Scecina Memorial2A31064.5%229.99
North Putnam2A28347.4%229.33
Elwood Community2A31770.0%228.29
Linton-Stockton2A27846.4%226.44
Hagerstown2A27443.4%226.39
Sheridan1A26335.9%225.20
Eastern Greene2A27748.0%223.82
Paoli2A27949.8%223.38
Perry Central2A26842.7%222.24
Central Noble2A27548.0%222.21
Forest Park1A25029.7%220.31
Eastside2A26844.6%220.23
Cloverdale1A23319.8%214.54
South Adams1A26245.9%213.94
LaVille2A26246.4%213.39
Henryville1A25339.6%212.94
Lafayette Central Catholic1A23323.5%211.14
Faith Christian1A2090.0%209.00
Knightstown1A25041.6%208.41
South Putnam2A25142.6%208.18
South Spencer2A25648.6%206.25
Riverton Parke1A25245.7%205.91
Union County1A26052.3%205.57
Clinton Prairie1A24240.7%202.61
Parke Heritage1A26055.3%202.47
Tecumseh1A23535.0%202.10
Monroe Central1A24947.9%201.32
South Central (Union Mills)1A23738.8%200.20
Taylor1A27165.5%199.99
Fort Wayne Blackhawk Christian1A21620.1%198.64
Whitko1A24347.8%196.49
Fountain Central1A24650.5%196.29
North Judson-San Pierre1A23944.8%196.13
Fremont1A23139.3%194.70
Indianapolis Lutheran2A21221.1%194.07
Winamac Community1A23747.1%192.31
Milan1A23345.7%190.39
Crawford County1A25565.5%188.23
West Washington1A23349.6%186.73
Madison-Grant1A21231.2%185.56
Lake Station Edison2A26575.9%184.58
North Knox1A23857.5%183.27
North Newton1A22043.3%181.86
Carroll (Flora)1A21843.8%179.84
North Decatur1A21945.1%179.49
Trinity Lutheran1A1849.4%177.06

CLASS 1A

30 schools · 89.50–174.97 adjusted enrollment
Class 1A schools ranked by adjusted enrollment
SchoolCurrent classGrades 9–11FRL rateAdjusted enrollment
Greenwood Christian Academy1A19323.4%174.97
Northfield1A21849.8%174.61
Caston1A20239.8%169.87
North Daviess1A20649.0%165.66
Bowman Leadership Academy1A22266.7%162.76
Pioneer1A19945.6%162.69
Triton1A19847.0%160.76
Southern Wells1A19139.6%160.76
South Newton1A19046.4%154.76
Covington1A18037.3%153.12
Southwood1A19149.8%152.99
North Vermillion1A19353.9%151.41
North Miami1A18647.3%150.78
Springs Valley1A19258.1%147.40
North Central (Farmersburg)1A18450.1%147.15
Wes-Del1A18757.2%144.21
Tri1A17039.0%143.48
South Decatur1A17145.1%140.15
Clinton Central1A16945.2%138.46
North White1A19475.8%135.19
Tri-County1A14738.9%124.12
Union City1A17168.7%123.99
Culver Community1A16259.7%123.31
Tri-Central1A14947.2%120.88
Frontier1A14034.9%120.48
Edinburgh1A15259.1%116.04
Tindley1A14863.5%110.40
Cambridge City Lincoln1A13461.2%101.18
Attica1A13058.6%99.51
West Central1A14999.8%89.50

05 / Explore the data

Sources & downloads